C2 Gateway Series 6 Hindsight
The Units in C2 - Gateway - Series 3 ("Series 3 Units") provide returns based on the "dispersion" of the Shares comprising the Reference Asset. Dispersion measures the deviation of the performance of individual shares relative to the performance of a basket.
C2 Gateway Series 6 Hindsight - Performance
| Coupons | Date |
| Commencement Date | Reference Asset Starting Level |
| Date | Reference Asset Level | Indicative Unit Value* | Reference Asset Performance Since Commencment |
C2 Gateway Series 6 Hindsight - Description
C2 Specialist Investments allows investors to access investment strategies and structures not readily available to retail investors in Australia. These types of investments are often known as “structured Investments” and are designed to facilitate highly customised risk-return objectives.
The Units in C2 Gateway - Series 6 Hindsight ("Series 6 Units") offer investors the ability to gain leveraged exposure to the performance of the Citi Radar 5 Excess Return Index (the “Reference Asset”) over the 4 year Investment Term.
Additionally, the C2 Gateway Series 6 – Hindsight Units offer:
-
- The ability to borrow 100% (100% LVR) of the investment amount via a Limited Recourse Loan, at an interest rate of 3.0025% p.a.
- Hindsight Feature. During the first six (6) months of the Investment, the Lowest Closing Price of the Reference Asset will be used as the Starting Price for calculations of Coupons. So, if the Reference Asset falls after the Commencement Date, then investors will get the benefit of the lower price.
- Potential Coupons
- Three potential Coupons of up to 4.5% each at the end of Year 1, Year 2 & Year 3; plus
- The potential for an uncapped Final Coupon (subject to a 10% Performance Fee) based on the performance of the Reference Asset
A summary of the key features are as follows
| Series 6 | |
| Reference Asset | Citi RADAR 5 Excess Return Index |
| Currency Exposure | AUD |
| Loan | Yes, 100% Loan (Limited Recourse) |
| Annual Interest Rate on Loan (Prepaid in advance) | 3.0025% p.a. |
| The Potential for 4 Coupons |
|
| Hindsight Feature | Yes, during the first six months |
| Averaging | Yes, during the final three months. |
| Application Fee | 0% |
| Ongoing Fees | 0% |
| Exit Fees | 0% |
| Performance Fee | 10% of Gross Coupons |
| Margin Calls | No |
| SMSF Eligibility | Yes |
What is the Hindsight Feature?
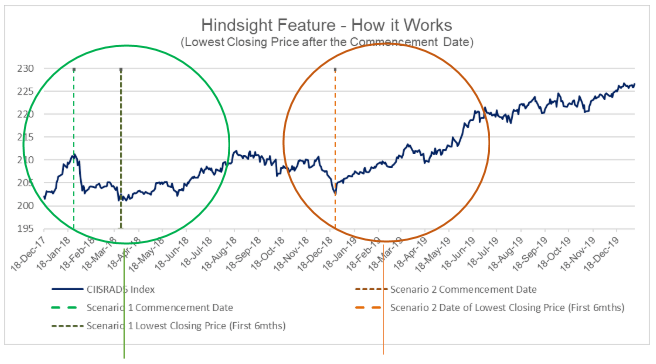
The Hindsight Feature will automatically record the lowest daily Closing Price of the Reference Asset in the first six months following the Commencement Date of the Investment (the “Hindsight Dates”). This Lowest Closing Price will become the Starting Price by which returns on the Units (in the form of Coupons) will be calculated. This feature helps take some of the guess work out of when to buy, particularly in volatile market conditions.
| Scenario 1 | Scenario 2 |
| Assume a Ccommencement dDate of 25 January 2018 and the Reference Asset closed at 210.36. Over the following 6 months the Reference Asset fell, and the Lowest Closing Price was 201.13 on 26 March 2018. 201.13This would be the Initial Starting Price for the calculations of Coupons. | Assume a Ccommencement dDate of 24 December 2018 and the Reference Asset closed at 202.57. Over the following 6 months the Reference Asset was never lower. As such, and so the Lowest Closing Price was 202.57 on 24 December 2018. This would be the Initial Starting Price for calculations of Coupons. |
Four potential Coupons at the end of Year 1, Year 2, Year 3 and Maturity
Investors may receive Coupon payments at the end of Year 1, Year 2, & Year 3 of up to 4.5% of the Issue Price per Unit, subject to the performance of the Reference Asset between the Commencement Date and the relevant Coupon Determination Date, and as reduced by a 10% Performance Fee (“Performance Fee”).
You may also receive an uncapped Final Coupon at Maturity (at the end of Year 4), subject to the performance of the Reference Asset (less previous coupons paid), and as reduced by a 10% Performance Fee (the “Final Coupon”).
All Coupons will be determined using the Starting Price (which is equal to the Lowest Closing Price as determined by the Hindsight Feature).
The Reference Asset: Citi RADAR Excess Return Index Methodology
The Reference Asset is published by Citigroup Global Markets Limited (“Citi”) and offers exposure to a Core Index of U.S ETFs (Exchange Traded Funds). The ETF’s that comprise the Core Index are adjusted algorithmically daily by Citi with reference to the prevailing Interest Rate Environment. See below for more information on Reference Asset.
Index Rationale: Part 1. Different equity sectors can react differently in response to changing market conditions
- The Index methodology is premised on the idea that there is a relationship between the prevailing interest rate environment in the United States and the relative performance of different sectors of the U.S. equity market. That idea, in turn, is based on the ideas below
Heading
Rising interest rates are often associated with a strong and growing economy and improving consumer sentiment:
- Strong consumer spending may spur higher borrowing, benefitting companies in the financials sector, which may also benefit from higher interest rates on loans.
- Strong economic activity may boost commodity prices, benefitting companies in the energy sector.
- In addition, strong consumer spending may lead to increased purchases of technology products, benefitting companies in the information technology sector.
By contrast, falling interest rates are often associated with efforts of the Federal Reserve to stimulate a slowing economy:
- Demand for basic necessities, such as utilities, consumer staples and health care, may be relatively constant.
- As a result, companies in the utilities, consumer staples and health care sectors may be less sensitive to economic growth and consumer sentiment.
- Companies in the utilities & consumer staples sectors have historically paid dividends at a relatively high rate, which may cause them to become relatively more attractive investments in periods of falling interest rates and relatively less attractive in periods of rising interest rates.
Index Rationale: Part 2: US Treasuries also react differently in response to changing interest rates
- The Index seeks to combine exposure to U.S. equity sectors with exposure to U.S. Treasury note futures and cash in an attempt to maintain a daily volatility target.
- A U.S. Treasury note futures contract is a contract for the purchase of U.S. Treasury notes with maturities falling within a specified range on a fixed date in the future. Accordingly, the value of a U.S. Treasury note futures contract will fluctuate1 with changes in the market value of the underlying U.S. Treasury notes.
- In general, the value of a U.S. Treasury note will fall as market interest rates rise, and rise as market interest rates fall.
10 Year Treasury Note Futures
- The 10yr U.S. Treasury Note futures contract is a contract to purchase U.S. Treasury notes with a remaining term to maturity of between 6.5 and 10 years.
- Longer duration Treasuries notes typically offer a higher yield than shorter durations, however they are also more sensitive to changes in market interest rates.
- As interest rates rise, longer duration Treasuries will lose value faster than shorter duration Treasuries.
Conversely, as interest rates fall, longer duration Treasuries will gain value faster than shorter duration Treasuries.
2 Year Treasury Note Futures
- The 2yr U.S. Treasury Note futures contract is a contract to purchase U.S. Treasury notes with a remaining term to maturity of between 1.75 and 2 years.
- Shorter duration Treasuries generally provide less yield than longer duration treasuries, but are impacted less by changes in market interest rate movements.
- Exposure to shorter duration Treasuries may be more appropriate during periods of rising market interest rates relative to longer duration Treasuries.
For more information on the about the Reference Asset and Reference Asset Methodology, you visit https://investmentstrategies.citi.com/indice/CIISRAD5/12/2 (select “Asia (Individual)”, then “Citi Radar 5 Excess Return Index”) or click on the image below to watch a short, illustrative explanation.
Past Performance
Historical information for the Reference Asset has been provided by the Issuer to potential investors for educational purposes only, to show investors the history of the Reference Asset. The Reference Asset has been live since 20 February 2019. For the period prior, 2 Jan 2003 to 20 February 2019 a simulation was used by Citigroup.
Past Performance is not indicative of likely future performance. Future returns should be expected to vary and may be negative.
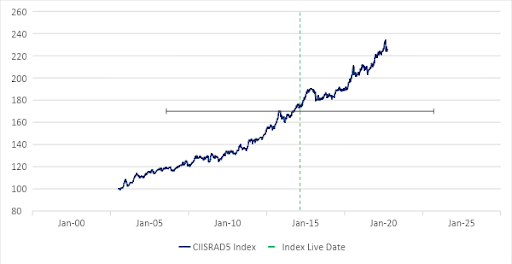
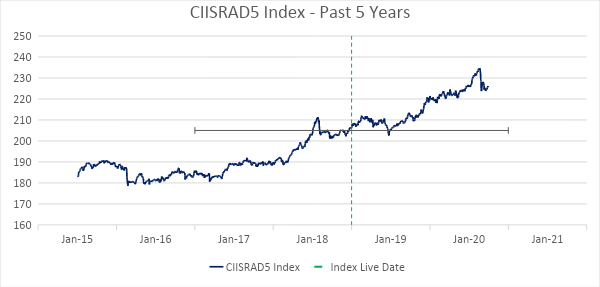
Historical Annualised Returns
| 1 year* | Since Live Date* | 3 year# | 5 year# | Since 2003# | |
| Citi RADAR 5 Excess Return Index | 6.4%p.a | 6.96%p.a | 6.00%p.a | 3.69%p.a | 4.83%p.a |
*Live data only
#Live data from 20 February 2020 to 1 April 2020,, simulated data prior
Source: Bloomberg/Citi/C2. Past performance is not a reliable indicator of future performance. Data for all charts, graphs and tables are as of 1 April 2020. Simulated past performance (back-tested) data from 1 February 2003 to 19 February 2019. Live performance of Citi RADAR 5 Excess Return Index since 20 February 2019. Simulated and live past performance data are provided for illustrative purposes only. Simulated and live past performance data should not be regarded as an indication of future results. Reference Asset performance takes into account deductions for fees and/or costs as specified in the Reference Asset’s index methodology. Further details are available in links below”.
How would the Units have performance over time?
The Historical Performance Simulations below have been provided to help investors see how the Units may have performed had the Units been available, incorporating the Hindsight Feature and the Coupons over 4 year periods with rolling 4 year Maturity Dates for the period 1 February 2007 to 1 April 2020, net of fees. Historical information has been used by the Issuer in order to provide an illustration of how the Investment may have performed over a defined period. This analysis has been prepared in good faith in accordance with the Issuer’s own internal models and calculation methods using publicly available market information sources where considered relevant. Analysis based on different models or assumptions may yield different results. Numerous factors may affect the analysis, which may or may not be taken into account. Therefore, this analysis may vary significantly from analysis obtained from other sources or market participants. Please contact the Issuer for more information if required. The Issuer does not guarantee the accuracy or completeness of this analysis or calculation methods, the accuracy or reliability of any market information sources used, any errors or omissions in computing or disseminating this analysis and cannot accept responsibility for any investment decision or use you make of it.
Past performance is not a reliable indicator of future performance.
| Net First Coupon | Net Second Coupon | Net Third Coupon | Net Final Coupon | Total Net Coupons | |
| Average | 3.91% | 3.81% | 4.01% | 8.40% | 20.13% |
| Minimum | 0.00% | 0.00% | 0.00% | 0.00% | 9.00% |
| Maximum | 4.50% | 4.50% | 4.50% | 23.94% | 37.44% |

Limitations of Simulated (Back-Tested) Performance Information
Index performance date is live for the period 20 February 2019 to 1 April 2020. All Index performance data prior to 20 Feb 2019 is hypothetical and back tested, as the Index did not exist prior to that date. Hypothetical back tested Index performance data is subject to significant limitations. The Index Administrator developed the rules of the Index with the benefit of hindsight that is, with the benefit of being able to evaluate how the Index rules would have caused the Index to perform had it existed during the hypothetical back tested period. The fact that the Index generally appreciated over the hypothetical back tested period may not therefore be an accurate or reliable indication of any fundamental aspect of the Index methodology. Furthermore, the hypothetical back tested performance of the Index might look different if it covered a different historical period. The market conditions that existed during the hypothetical back tested period may not be representative of market conditions that will exist in the future In addition, the sectors tracked by the equity sector ETFs have been modified in important ways during the hypothetical back tested period As a result, the hypothetical back tested performance of the Index may not reflect how the Index would have performed had the sectors tracked by the equity sector ETFs during the back tested period been defined in the way they are currently defined. It is impossible to predict whether the Index will rise or fall In providing the hypothetical back tested and historical Index performance data above, no representation is made that the Index is likely to achieve gains or losses similar to those shown In fact, there are frequently sharp differences between hypothetical performance results and the actual results subsequently achieved by any particular investment. One of the limitations of hypothetical performance information is that it did not involve financial risk and cannot account for all factors that would affect actual performance The actual future performance of the Index may bear no relation to the hypothetical back tested or historical performance of the Index.
Find out more about C2 Structured Investments
Complete the form below and we'll be in touch as soon as possible.
C2 Gateway Series 6 Hindsight - Key Dates
| Offer Opening Date | 15 April 2020 |
| Offer Closing Date | 15 May 2020 |
| Interest Payment Date (Application Payment Date) | 15 May 2020 |
| Commencement Date / Issue Date | 22 May 2020 or as soon as reasonably practicable thereafter as determined by the Issuer and as notified to you. |
| Hindsight Dates (for the purposes of determining the Lowest Closing Price of the Reference Asset) | Commencement Date until 22 November 2020 |
| First Coupon Payment Date at end of Year 1 | 24 May 2021 |
| Second Coupon Payment Date at end of Year 2 | 23 May 2022 |
| Third Coupon Determination Date at end of Year 3 | 22 May 2023 |
| Fourth Coupon Determination Date at end of Year 4 | 22 May 2024 |
| Maturity Date | 22 May 2024 |
| Coupon Payment Dates | 10 Business Days after the relevant Coupon Determination Date or as soon as reasonably practicable thereafter as determined by the Issuer |
| Buy-Back Dates | Quarterly on the last Business Day of March, June, September and December commencing from September 2020 (or otherwise at the Issuer's discretion). Investors must lodge their Issuer Buy-Back Form no later than 10 Business Days before the relevant Buy-Back Date. Any Issuer Buy-Back Form received after this time will be held over to the next Buy-Back Date.
The Buy-Back Price will not ever be less than $1.00 per Unit and will be applied to repay your Loan first. You will not have to pay any other fees, costs or interest in connection with an Issuer Buy-Back. |
| Settlement Date | 10 Business Days after the Maturity Date, or such other date as determined by the Issuer in its discretion as is reasonably necessary for the Issuer to fulfil its obligations under the Terms. |
1 This Timeline is indicative only. The Issuer may, in its discretion, extend or shorten the Initial Offer Period for a Series without prior notice. If this happens, the Commencement Date and one or more consequential dates for the Series may vary. The Issuer may also defer the Commencement Date for a Series, in which case the Maturity Date and other consequential dates for the Series may vary. If the Issuer varies the Initial Offer Period, the Commencement Date, Coupon Dates or Maturity Date for a Series it will post a notice on the website informing applicants of the change at this website. If a date set out in the table above is not a Business Day, then the relevant date will be the next following Business Day.
Find out more about C2 Structured Investments
Complete the form below and we'll be in touch as soon as possible.
C2 Gateway Series 6 Hindsight - Risks
- Your return (including any Coupons) is affected by the performance of the Reference Asset. There is no guarantee that the Reference Asset will perform well.
- No Coupons will be payable if the performance of the Reference Asset is negative at the relevant Coupon Determination Date, or the performance of the Reference Asset is not higher than the sum of any Coupons already paid.
- There is no guarantee that the Units will generate returns in excess of the Prepaid Interest and Fees, during the Investment Term and you could lose some or all of your Prepaid Interest and any Fees paid at Commencement. Additionally, in the event of an Investor requested Issuer Buy-Back or Early Maturity Event, you will not receive a refund of your Prepaid Interest or Fees.
- Gains (and losses) may be magnified by the use of a 100% Loan. However, note that the Loan is a Limited Recourse Loan, so you will never lose more than the Prepaid Interest and any Fees paid at Commencement.
- Investors are subject to counterparty credit risk with respect to the Issuer and the Hedge Counterparty; and the Units may mature early following an Early Maturity Event, including an Adjustment Event, Market Disruption Event or if the Issuer accepts your request for an Issuer Buy-Back.
For more information on the applicable risks, please refer to Section 2 “Risks” of the Master PDS and to the Reference Asset “Plain English Risk Factors” guide published by Citi Here.
Find out more about C2 Structured Investments
Complete the form below and we'll be in touch as soon as possible.
C2 Gateway Series 6 Hindsight - Literature
- PR 2020/2 Income tax: taxation consequences of investing in C2 Gateway
- Product Disclosure Statement
- Product Flyer
- Master Product Disclosure Statement
Find out more about C2 Structured Investments
Complete the form below and we'll be in touch as soon as possible.
C2 Gateway Series 6 Hindsight - Disclaimer
Units in C2 Gateway Series 6 - Hindsight are is issued by C2 Specialist Investments Pty Ltd (ACN 622 433 032) (“the Issuer”) and arranged by C2 Financial Services Pty Ltd (AFSL: 502171. ACN 621 428 635) (“the Arranger”) pursuant to Section 911A(2)(b) of the Corporations Act. Investments in the C2 Gateway Series 6 – Hindsight can only be made by completing an Application Form attached to the Term Sheet Product Disclosure Statement (“TSPDS”), after reading the Term Sheet PDS dated 15 April 2020 and the Master PDS dated 25 March 2020 and submitting it to the Issuer. A copy of the PDS can be obtained by contacting C2 Specialist Investments on 02 8098 0300 or contacting your financial adviser. You should consider the Term Sheet & Master PDS’ before deciding whether to invest in Units in C2 Gateway Series 6 - Hindsight. Capitalised terms have the meaning given to them in Section 10 “Definitions” of the Master PDS or in the TSPDS. This information has been prepared by the Issuer for general promotional purposes only and is not an offer to sell or solicitation to buy any financial products. This information does not constitute personal advice and has been prepared without taking into account your objectives, financial situation or needs. You should consider obtaining professional advice as to whether this financial product suits your objectives, financial situation or needs before investing. You should seek independent advice in relation to the tax implications of your investment. The Issuer may, in its discretion, extend or shorten the Offer Period for the Units without prior notice. If this happens, the Commencement Date and one or more consequential dates for the Units may vary. The Issuer may also defer the Commencement Date for the Units, in which case the Maturity Dates and other consequential dates for the Units may vary. If the Issuer varies the Offer Period or the Commencement Date for the Units it will post a notice on this website.
Past Performance Disclaimer
Historical information for the Reference Asset has been provided by the Issuer to potential investors for educational purposes only, to show investors the history of the Reference Asset. The Reference Asset has been live since 20 February 2019. For the period prior, 2 Jan 2003 to 20 February 2019 a simulation was used by Citigroup.
Past Performance is not indicative of likely future performance. Future returns should be expected to vary and may be negative.
Source: Bloomberg/Citi/C2. Past performance is not a reliable indicator of future performance. Data for all charts, graphs and tables are as of 1 April 2020. Simulated past performance (back-tested) data from 1 February 2003 to 19 February 2019. Live performance of Citi RADAR 5 Excess Return Index since 20 February 2019. Simulated and live past performance data are provided for illustrative purposes only. Simulated and live past performance data should not be regarded as an indication of future results. Reference Asset performance takes into account deductions for fees and/or costs as specified in the Reference Asset’s index methodology.
Limitations of Simulated (Back-Tested) Performance Information
Index performance date is live for the period 20 February 2019 to 1 April 2020. All Index performance data prior to 20 Feb 2019 is hypothetical and back tested, as the Index did not exist prior to that date. Hypothetical back tested Index performance data is subject to significant limitations. The Index Administrator developed the rules of the Index with the benefit of hindsight that is, with the benefit of being able to evaluate how the Index rules would have caused the Index to perform had it existed during the hypothetical back tested period. The fact that the Index generally appreciated over the hypothetical back tested period may not therefore be an accurate or reliable indication of any fundamental aspect of the Index methodology. Furthermore, the hypothetical back tested performance of the Index might look different if it covered a different historical period. The market conditions that existed during the hypothetical back tested period may not be representative of market conditions that will exist in the future In addition, the sectors tracked by the equity sector ETFs have been modified in important ways during the hypothetical back tested period As a result, the hypothetical back tested performance of the Index may not reflect how the Index would have performed had the sectors tracked by the equity sector ETFs during the back tested period been defined in the way they are currently defined. It is impossible to predict whether the Index will rise or fall In providing the hypothetical back tested and historical Index performance data above, no representation is made that the Index is likely to achieve gains or losses similar to those shown In fact, there are frequently sharp differences between hypothetical performance results and the actual results subsequently achieved by any particular investment. One of the limitations of hypothetical performance information is that it did not involve financial risk and cannot account for all factors that would affect actual performance The actual future performance of the Index may bear no relation to the hypothetical back tested or historical performance of the Index.
Reference Asset Disclaimers
Citi is a registered trademark and service mark of Citigroup Inc. or its affiliates and is used and registered throughout the world. C2 Gateway Series 6 - Hindsight (“the Units”) are not sponsored, endorsed, sold or promoted by Citigroup, and Citigroup makes no representation regarding the advisability of investing the Units. Citigroup gives no express or implied warranties, including, but not limited to, any warranties of merchantability or fitness for a particular purpose or use. In no event shall Citigroup be liable for any direct, indirect, special or consequential damages in connection with any use of the Citigroup data and information.
Find out more about C2 Structured Investments
Complete the form below and we'll be in touch as soon as possible.
Subcribe to our monthly newsletter
Covering important superannuation, SMSF, and investment markets commentary
Thanks for subscribing!
Important Information
Get In Touch
- 02 8098 0300
- Send message
- Level 14, 109 Pitt Street,
SYDNEY NSW 2000 - PO Box R1373
Royal Exchange NSW 1225

